Your ERP Data,
One Question Away
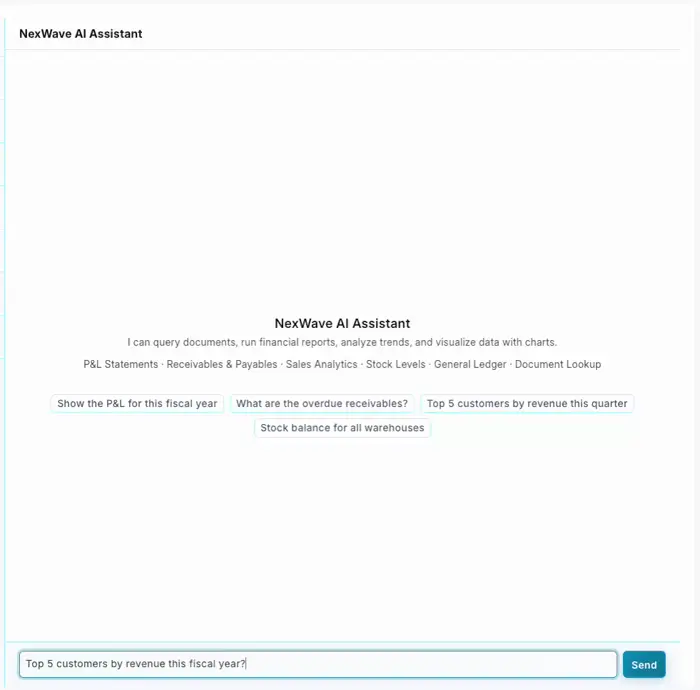
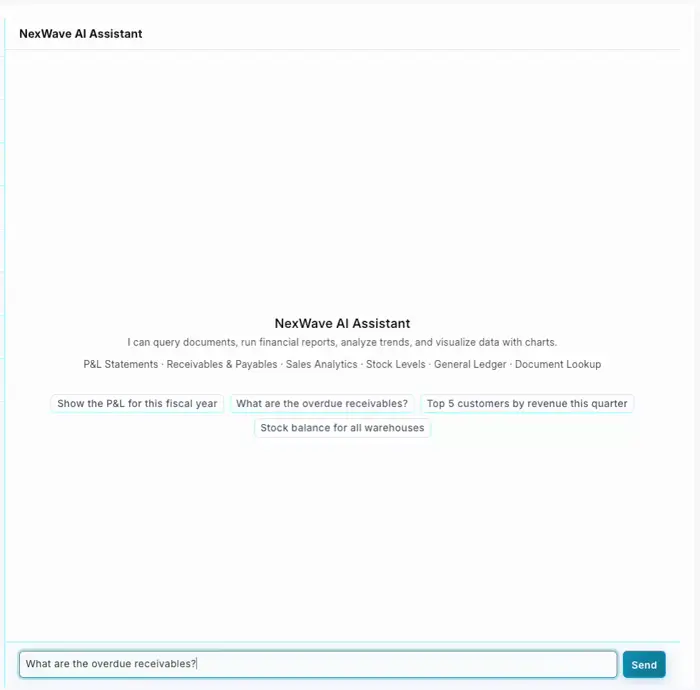
Ask questions about your business in plain English. NexWave AI instantly analyses your live data, runs reports, and presents insights with charts and tables.
NexWave AI Assistant
Online
Here's the aging summary:
| Customer | 0-30 | 31-60 | 61-90 |
|---|---|---|---|
| Acme Ltd | $4,200 | $1,800 | $3,100 |
| Beta Corp | $2,500 | $900 | — |
| + 6 more customers... | |||
How It Works
From question to insight in seconds — no training required.
Ask a Question
Type any business question in plain English — no SQL, no report navigation, no training needed.
AI Analyses Your Data
The assistant queries your live ERP data, runs the right reports, and performs calculations automatically.
Get Actionable Insights
Receive formatted tables, charts, and summaries with clickable links to the source documents.

Instant Financial Insights
- Profit & Loss statements with monthly, quarterly, or yearly breakdowns
- Balance sheet analysis with comparative period views
- General ledger drill-down by account, party, or cost center
Try asking:
"Show me the P&L for this fiscal year with a monthly breakdown"
Understand Your Revenue
- Top customers ranked by revenue with trend analysis
- Sales performance by territory, item group, or salesperson
- Order fulfilment tracking and sales pipeline visibility
Try asking:
"Who are the top 5 customers by revenue this quarter?"
Stay on Top of Cash Flow
- Aging analysis with 30, 60, 90, and 120-day buckets
- Overdue invoice tracking by customer or supplier
- Payables summary to manage outgoing payment schedules
Try asking:
"What are the overdue receivables?"
Real-Time Stock Visibility
- Stock levels across all warehouses at a glance
- Movement history with transaction-level detail
- Value analysis by item group or warehouse
Try asking:
"What's the current stock balance across all warehouses?"

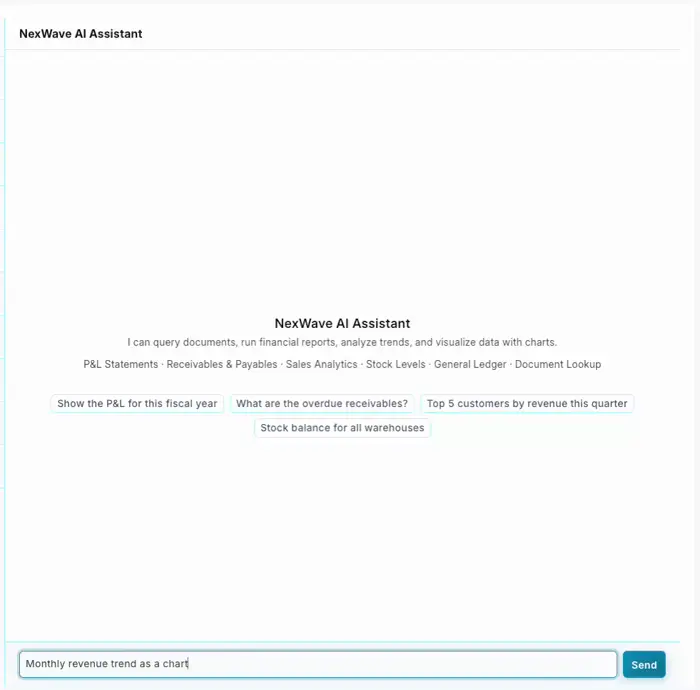
Data Visualised, Not Just Listed
- Bar, line, pie, and donut charts generated automatically
- Every chart paired with a detailed data table
- Formatted responses with clickable links to source documents
Try asking:
"Show me the monthly revenue trend for the last 12 months as a chart"
Everything Your Team Needs
A comprehensive AI assistant built for every department in your business.
Financial Reports
P&L, Balance Sheet, Trial Balance, General Ledger
Receivables & Payables
Aging analysis, outstanding invoices, payment tracking
Sales Analytics
Revenue by customer, territory, item, salesperson
Stock & Inventory
Real-time levels, movements, warehouse balances
Document Lookup
Find any document — orders, invoices, payments
Smart Calculations
Accurate math — percentages, totals, growth rates
Chart Visualizations
Bar, line, pie, donut charts from your data
Permission-Based
Only see data you're authorised to access
Natural Language
Ask in plain English, no training required
Ready to talk to your data?
See how NexWave AI can transform how your team accesses business insights.